
The Funnel consists of a step of steps that a person has to go through in order to be a customer of AIESEC and this analysis measures how well such steps are executed in each phase. The funnel mechanism is used to measure how the applicants move through the process until they are completely satisfied with the products we offer.
- This can be accessed via the Analytics options in the left corner represented by the Pie Chart symbol or via the Analytics Quick Link
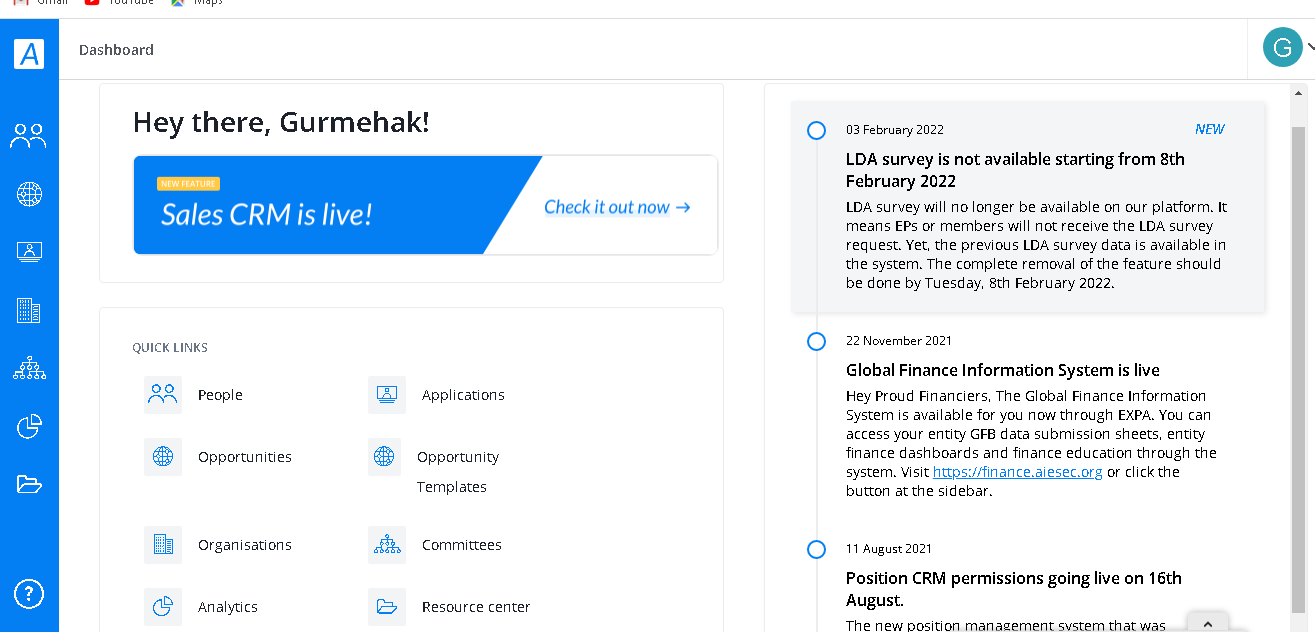
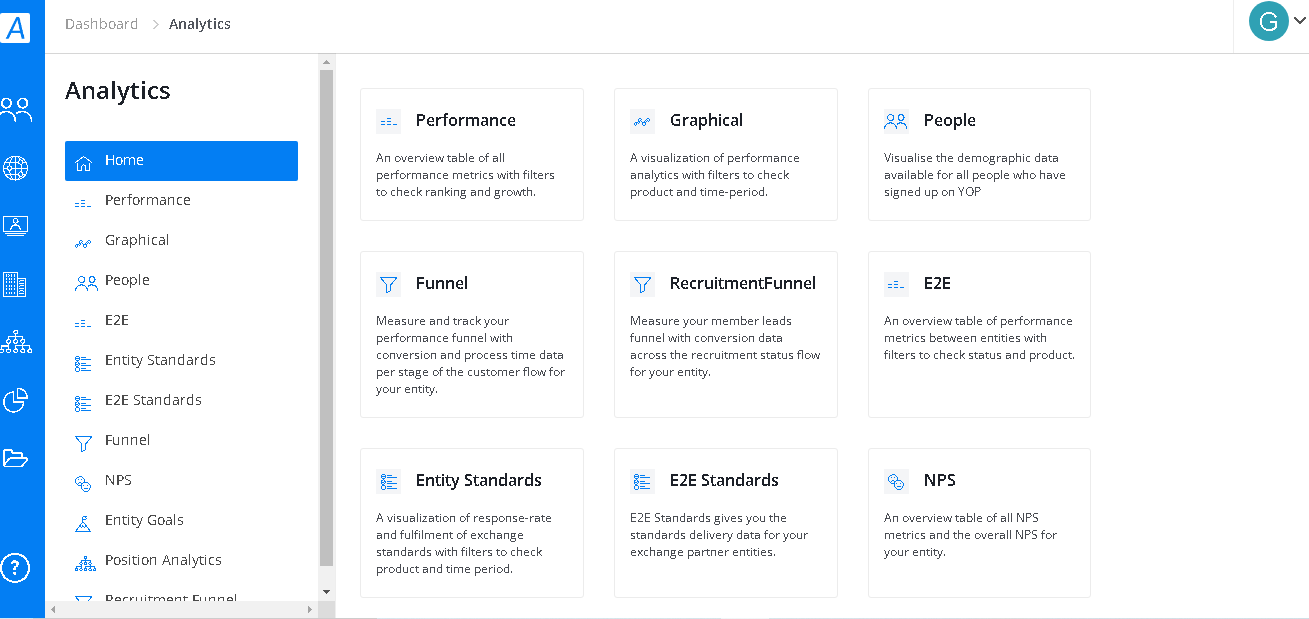
- If you click on the quick link, you will be guided to the following page which shows all the analytic types in boxed formats. If you click on the pie chart icon, these types would appear in a drop a down menu format. From the below options, select Funnel Analysis.
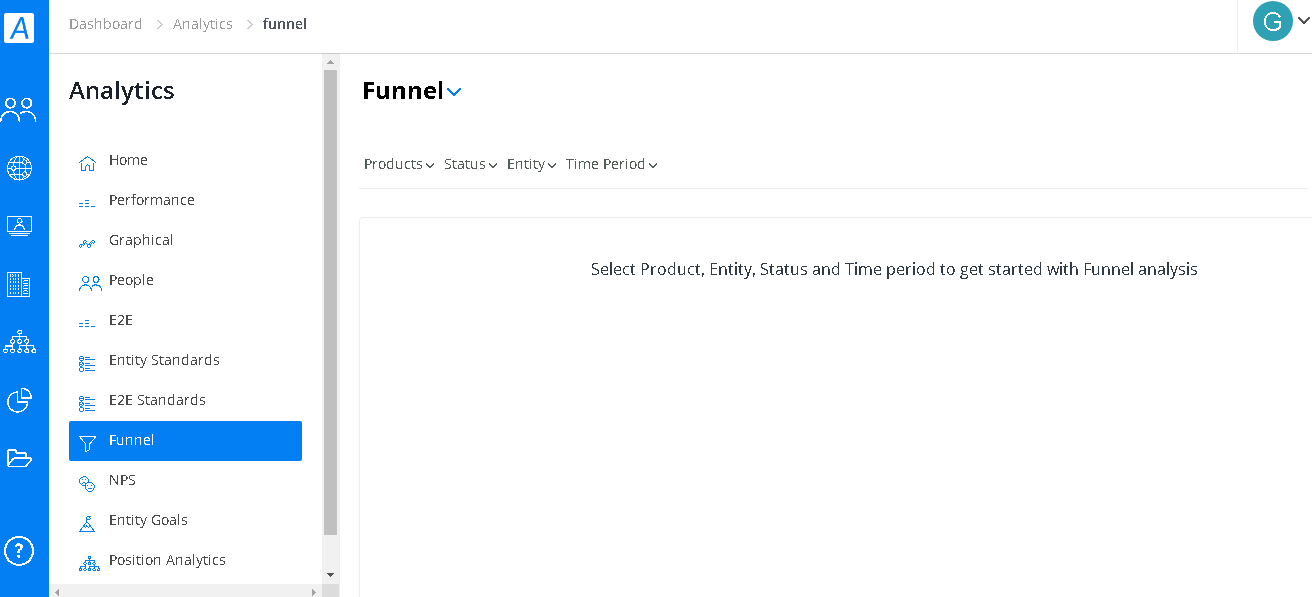
- Once you select it, you will be directed to a page as follows where you can select the product, entity and time period because in AIESEC we don't look at how our sign-ups moved across the funnel until this person has completed an experience. We actually look at the results we had in a certain period of time and calculate conversions out of it.
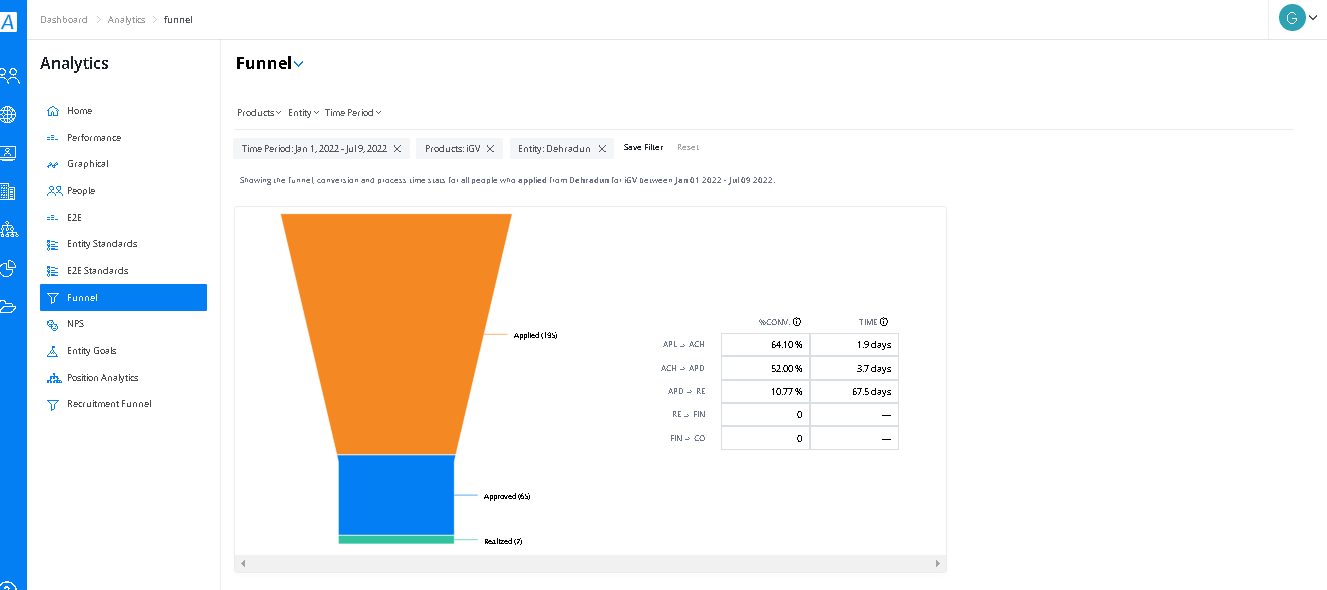
- Once you set your parameters (as you will see below), the following image/graph will appear which measures Absolute numbers, Conversion Statistics and Process Time data.
DIFFERENCE BETWEEN PERFORMANCE ANALYTICS AND FUNNEL ANALYTICS :
Performance analytics shows the results a certain entity had in a specific period of time, based on the actions performed. Funnel analytics shows only how many people that signed up (OGX) / applied (ICX) in a specific period of time are moving across the exchange funnel.
Comments
0 comments
Please sign in to leave a comment.